|
On with the tips:
If someone tells you to jump off a cliff: templates wrongly encourage repetition… but that doesn’t mean we must be repetitive. Instead, give honest answers. If your report must include a section on Impact on GDPR, but the impact is: “None”, just say so. (Yes, I know this tip sounds obvious, but most people churn out boiler-plate waffle just to fill an unwanted section.)
Have checklists instead: templates ensure we comment on everything (EU, GDPR, etc); checklists ensure we think about everything... but not necessarily comment on them all. For more minor topics, let silence imply satisfaction. Hence, if a report says nothing about a topic - if there's not even a section on it within the report - then that topic isn't relevant. Easy.
For more major topics, have a number of tick-boxes: group them near the start of the report. Maybe have a box for EU, Diversity, GDPR, etc. The author ticks each box and puts a name alongside it – the name of the person responsible for that area (e.g. alongside the GDPR box is the name of the company’s GDPR officer). Maybe get these people to sign their box. Then under the boxes, write: “These people are comfortable with the project’s proposals, subject to their comments on page 10”. If anyone then writes something on page 10, it had better be good, not anodyne boiler-plate waffle. How many tick-boxes do we need? It depends. If bosses trust us, we don’t need many, if any. If bosses don’t, we need a lot.
To make this approach even more effective, also do the following:
Give guidance to writers: tell them to avoid stuff that doesn’t pass the Not test (I’ve mentioned this in previous emails) and avoid stuff that’s so general, anyone could write it.
Tell readers they’ve a responsibility too: if they receive bad stuff, send it back. Word will quickly spread that the boss hates waffle.
But templates often create an 'Eric Morecambe' problem: the UK comic said about his piano-playing: "I'm playing all the right notes. But not necessarily in the right order." So too with reports – often, we've the right stuff but not in the right order. You see, previously, I’ve said: start with the conclusion. But if the template’s first heading is Introduction (or Guidance or Background), and the last is Conclusion and Recommendation, we’ve a problem: how can we start with the conclusion, given we’re told to put it last?
The answer is: pretend we follow the template. That is, start with the conclusion anyway, but have a final sentence that links back to the template – so if the template's first heading is Introduction, write the following: “I want £10k to spend on IT to help us do blah. It will take X months, the risk is blah, alternatives blah, benefits blah…” and so on, until at the end of this section we write: “That’s the Introduction – the rest of the report gives details”.
Or, if the first heading is Guidance, write: “That’s the Guidance – the rest of the report gives details”. Or: “That’s the Background, etc”. Get the picture? (And when bosses reach page 8 and read the final section (Conclusion), maybe simply write: “See Introduction”...)
Subversive? A bit. What will bosses think? They might not even spot it – many people think it fine to put a brief summary in a section entitled Guidance or Background or Introduction. And even if bosses spot it, they might not mind anyway. As a boss once told me: “Content triumphs over format”. A good report that doesn’t follow corporate standards beats a bad one that does.
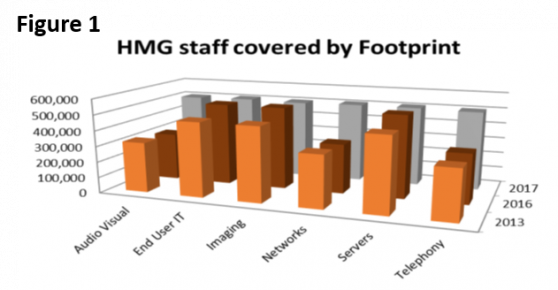
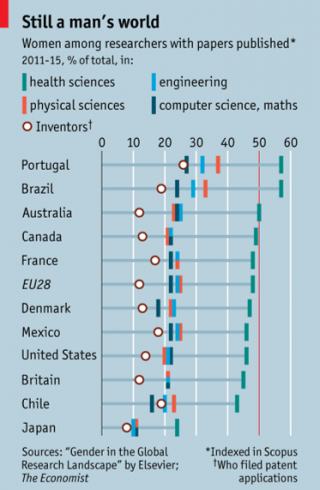
That's it on templates. The rest of this email looked at bad graphs.
|